


 Multi-Vendor & Complex SaaS Marketplaces
 Modern Headless & Jamstack Web Development
 High-End Corporate & Specialized Business Websites
 Advanced API, Checkout & Database Troubleshooting
Replace Manual Server Checks with Uptime Kuma in 30 Minutes
Stop logging into five servers every morning. Set up one Uptime Kuma dashboard, keep all hosts green, and get SMS alerts when something breaks—practical remote steps for Australian small businesses.
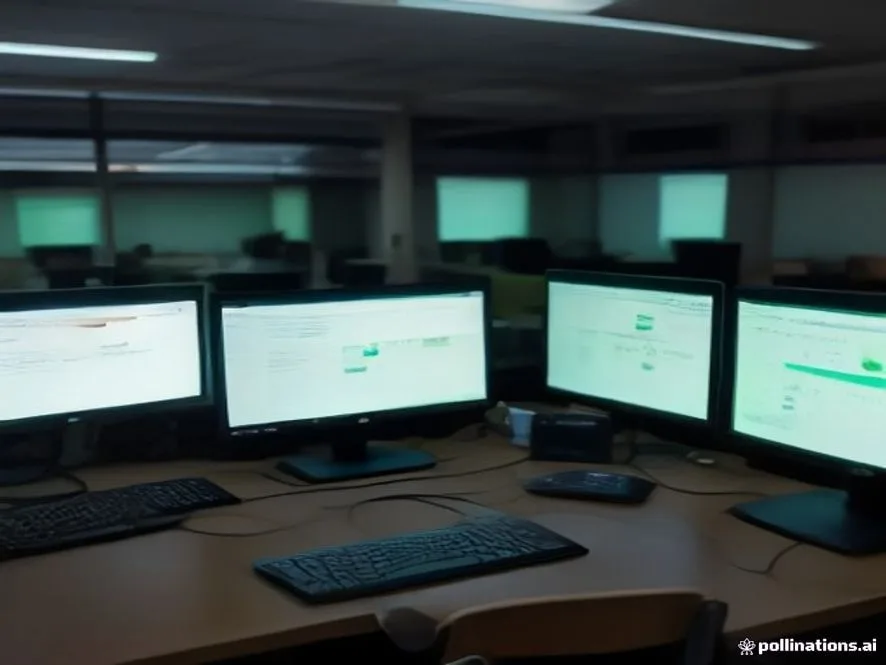
If you still SSH into five servers before coffee just to confirm nginx is up, disks are not full, and the app responds, you are burning an hour a day on work a monitor should own. This guide walks Australian site owners and small-business operators through replacing that ritual with Uptime Kuma: one dashboard, five (or more) hosts, green status at a glance, and SMS when something fails—often within about thirty minutes of focused setup.
Fixwebnode provides remote Linux and Ubuntu server support across Australia. We help you install the stack cleanly, wire real checks (HTTP, TCP, ping, Docker), and lock down alerts so you only get woken for genuine outages—not noise.
Why manual morning checks fail Australian teams
Manual logins miss overnight failures until someone notices. They also skip consistent thresholds: one person checks df -h, another only hits the homepage. Uptime Kuma centralises HTTP(S), keyword, port, ping, and Docker host monitors, stores history, and pushes Telegram, Discord, email, or SMS-capable webhooks the moment a probe fails.
Remote delivery suits Australia well: the monitor can live on a small VPS or a spare Ubuntu host you already run, while production sites stay untouched except for allowing health-check traffic. When geography matters for ongoing care, see our service areas.
How do I stop logging into five servers every morning with Uptime Kuma in Australia?
Install Uptime Kuma once (Docker is the fastest path), add one monitor per critical endpoint or port, then connect a notification channel that can reach your phone via SMS gateway or a bridge such as Twilio, Pushbullet, or a carrier email-to-SMS address. After that, open the dashboard instead of five SSH sessions; only act when status turns red or your phone buzzes.
| Symptom | Quick fix | When to call Fixwebnode |
|---|---|---|
| All monitors red, sites fine | Check firewall allowlist and monitor URL/port | Complex multi-host networking or reverse proxies |
| No SMS on outage | Test notification; verify API keys and rate limits | Custom webhook or multi-channel routing |
| Kuma itself unreachable | Restart container; check bind port and TLS proxy | Hardened reverse proxy, SSO, or HA layout |
Common issues when replacing manual checks with Uptime Kuma
These are the failure modes we see most when teams move from “login and look” to automated probes.
1. False downs: monitors red while production is healthy
Symptoms: dashboard shows timeout or connection refused; customers report no problem; SSH still works. Often the probe hits the wrong vhost, HTTP instead of HTTPS, an internal-only port, or a firewall that allows your laptop but not the Kuma host.
2. SMS or push alerts never arrive
Symptoms: status flips to DOWN in the UI, history records the outage, but your phone stays silent. Typical causes: empty notification binding on the monitor, wrong API token, provider sandbox mode, or Australian mobile numbers formatted without the correct international prefix.
3. Uptime Kuma container dies or port 3001 is dark
Symptoms: browser cannot open the dashboard; docker ps shows Exited; disk full under the data volume; host reboot without --restart=always.
4. Checks pass the homepage but miss app or API failure
Symptoms: marketing site returns 200, yet login, checkout, or an API path is broken—the same gap manual “open the home page” checks create. You need keyword, JSON, or authenticated path monitors, not only root URL pings.
How to fix each issue (DIY runbook)
Fix 1 — Clear false downs and aim probes correctly
Confirm the Kuma host can reach each target the same way users do.
Step 1 — From the Kuma server, test the exact URL or port
curl -sI https://your-site.example/
curl -sI https://your-site.example/health
nc -vz your-db-host.example 5432
ping -c 3 your-host.example
If curl fails here, the monitor will fail too. Fix DNS, TLS, or firewall before blaming Kuma.
Step 2 — Allow the monitor source in the firewall
sudo ufw status numbered
# example: allow HTTPS from the Kuma host only
sudo ufw allow from KUMA_SERVER_IP to any port 443 proto tcp
sudo ufw reload
Step 3 — In Uptime Kuma, edit the monitor
- Type: HTTP(s) for sites; TCP for databases/SSH; Ping only when ICMP is allowed.
- URL must match the public certificate name (https, correct host header).
- Interval 60s is fine for most SMB sites; retries 2–3 reduces flapping on brief blips.
- Optional: keyword monitor for a string that only appears when the app is truly healthy.
Step 4 — Verify
Force a recheck in the UI. Status should go green within one interval. On the target host, confirm access logs show the Kuma user-agent or source IP.
Call Fixwebnode when targets sit behind Cloudflare Access, mutual TLS, or private VPC paths that need a stable egress design rather than opening the world.
Fix 2 — Make SMS (or phone-reachable) alerts actually fire
Uptime Kuma talks to notification providers; SMS usually means Twilio, a local SMS API, email-to-SMS, or a bridge (Telegram/Discord on your phone as a fast interim).
Step 1 — Add a notification channel in Kuma
Settings → Notifications → Setup Notification. Choose your provider, paste API credentials, and send the built-in test. For Australian mobiles, use E.164 form (for example +614xxxxxxxx), not a leading zero local format.
Step 2 — Attach the channel to every critical monitor
Open each monitor → Notifications → enable the channel. A global default is not enough if older monitors were created before the channel existed.
Step 3 — Simulate a failure safely
# temporarily point a test monitor at a closed port on localhost
curl -sI http://127.0.0.1:9 || true
Or pause the real service for one interval on a staging host only. Confirm DOWN in Kuma and a message on your phone within the retry window.
Step 4 — Tame noise
- Enable “resend notification if down X times” thoughtfully so brief CDN blips do not spam you.
- Use separate channels for “page me” versus “log only”.
- Document who owns the on-call phone overnight.
Book Fixwebnode when you need webhook fan-out into existing ops tools—similar automation work to our webhook integrations and automated workflow development—or multi-site alert routing without false pages.
Fix 3 — Stabilise the Uptime Kuma install itself
Prerequisites: Ubuntu 22.04/24.04 (or similar), Docker Engine installed, a host that is not the only copy of production data.
Step 1 — Install Docker if needed
sudo apt update
sudo apt install -y ca-certificates curl
sudo install -m 0755 -d /etc/apt/keyrings
curl -fsSL https://download.docker.com/linux/ubuntu/gpg | sudo gpg --dearmor -o /etc/apt/keyrings/docker.gpg
echo "deb [arch=$(dpkg --print-architecture) signed-by=/etc/apt/keyrings/docker.gpg] https://download.docker.com/linux/ubuntu $(. /etc/os-release && echo $VERSION_CODENAME) stable" | sudo tee /etc/apt/sources.list.d/docker.list > /dev/null
sudo apt update
sudo apt install -y docker-ce docker-ce-cli containerd.io docker-compose-plugin
sudo systemctl enable --now docker
Step 2 — Run Uptime Kuma with a persistent volume and restart policy
sudo docker run -d \
 --name uptime-kuma \
 --restart=always \
 -p 3001:3001 \
 -v uptime-kuma:/app/data \
 louislam/uptime-kuma:1
Step 3 — Confirm the container and UI
sudo docker ps --filter name=uptime-kuma
sudo docker logs --tail 50 uptime-kuma
curl -sI http://127.0.0.1:3001
Browse to http://YOUR_SERVER_IP:3001, create the admin user immediately, and set a strong password.
Step 4 — If the container exited, diagnose disk and restart
df -h
sudo docker start uptime-kuma
sudo docker inspect uptime-kuma --format '{{.State.Status}} {{.HostConfig.RestartPolicy.Name}}'
Put nginx or Caddy in front with TLS for public access; never leave admin on plain HTTP to the open internet. Prefer VPN or IP allowlist where practical.
Step 5 — Optional compose file for clearer upgrades
cat <<'EOF' | sudo tee /opt/uptime-kuma/compose.yml
services:
 uptime-kuma:
 image: louislam/uptime-kuma:1
 container_name: uptime-kuma
 restart: always
 ports:
 - "3001:3001"
 volumes:
 - uptime-kuma:/app/data
volumes:
 uptime-kuma:
EOF
cd /opt/uptime-kuma && sudo docker compose up -d
Call Fixwebnode if you need a hardened reverse proxy, automated backups of the /app/data volume, or the monitor host treated as production-critical infrastructure.
Fix 4 — Monitor what actually breaks (not only the homepage)
Map the same paths you used to check by hand.
Step 1 — List critical user journeys
- Homepage and TLS expiry
- Login or membership gate
- API health or
/wp-jsonwhere relevant - Payment return URL or cart endpoint
- SSH/TCP on admin hosts you previously poked manually
Step 2 — Add matched monitor types
- HTTP(s) + expected status code
- HTTP(s) - Keyword for a logged-out string that proves PHP/app rendered
- TCP Port for Postgres, Redis, or SMTP relays
- Docker container status if apps run on the same Docker host
Step 3 — On WordPress or membership stacks, verify app-level health
curl -sI https://your-site.example/wp-login.php
curl -s https://your-site.example/ | head -n 20
If membership billing or MemberPress-style flows are in scope, shallow homepage monitors are not enough—align checks with the real checkout path, the same discipline used in specialised WordPress membership and Stripe setups.
Step 4 — Recreate your old morning checklist as tags
Tag monitors prod, edge, db. One filtered dashboard view replaces five terminal tabs.
Escalate to Fixwebnode when synthetic checks need authenticated sessions, multi-step flows, or coordinated monitoring across app and webhook backends.
When DIY is enough vs when to book Fixwebnode
DIY is enough when you control a single Ubuntu VPS, can open Docker port 3001 behind TLS or VPN, and your five servers expose simple public HTTP or TCP health points. The install above plus careful monitor URLs and one tested notification channel covers most small Australian businesses.
Book Fixwebnode when any of these apply:
- False alerts continue after firewall and URL fixes (proxies, anycast, or geo routing in the path).
- You need SMS plus escalation policies, quiet hours, or integration into existing webhooks.
- The monitor must sit in a private network and reach internal services safely.
- Kuma data must be backed up, restored, and treated like production.
- You still lack confidence after a failed container, full disk, or broken reverse proxy.
We work as a direct remote specialist—not a freelance marketplace. You speak with the people doing the server work, including Ubuntu troubleshooting and ongoing server support for teams who are done with hour-long morning logins.
Get your five servers on one green dashboard
Manual checks feel responsible until the first silent overnight outage. Uptime Kuma turns that habit into a thirty-minute build: persistent Docker install, honest probes, and alerts that reach your phone when status leaves green.
If you want this installed, hardened, and verified on your hosts—or you are mid-incident and the dashboard itself will not stay up—start a conversation with Fixwebnode via our Linux server support page. Tell us how many servers you check each morning and which alert channel you trust; we will map monitors to the paths that actually matter and leave you with one screen instead of five logins.