





 Multi-Vendor & Complex SaaS Marketplaces
 Modern Headless & Jamstack Web Development
 High-End Corporate & Specialized Business Websites
 Advanced API, Checkout & Database Troubleshooting
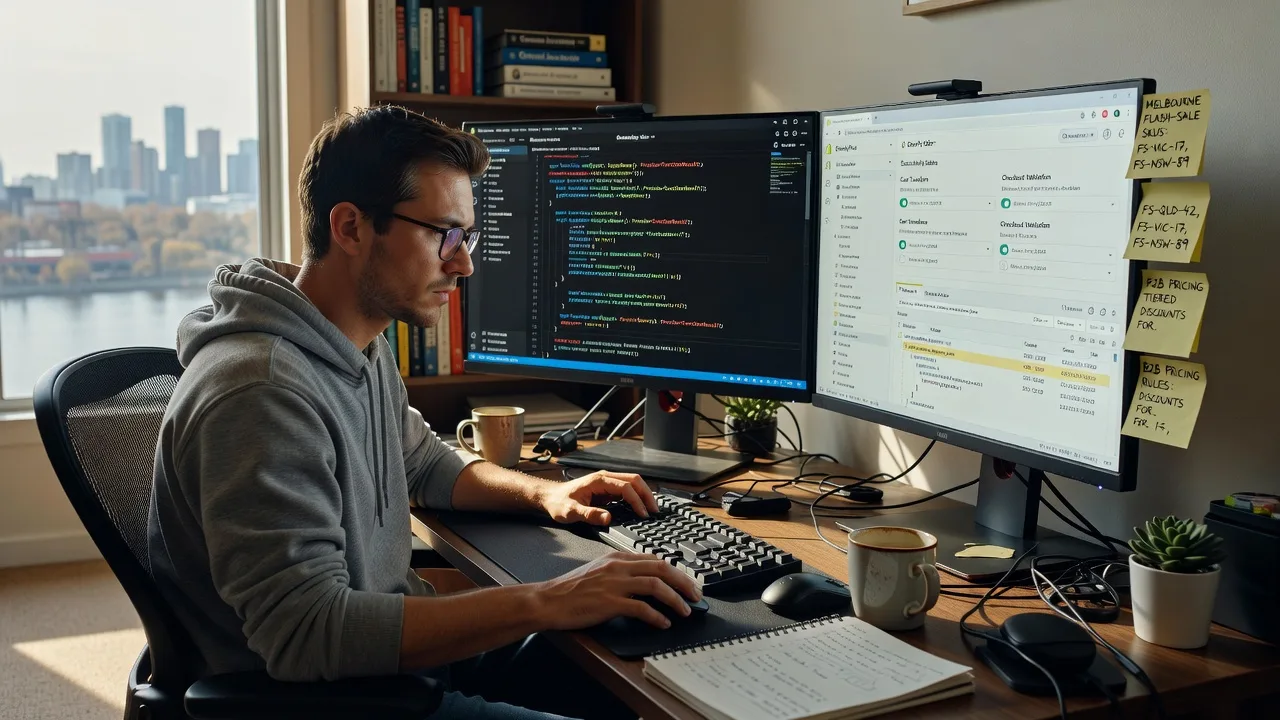
Custom Dashboard Development for Melbourne Teams
Ship decision-ready dashboards for Melbourne operators who need live KPIs—not spreadsheet chaos.
I design and build custom analytics and ops dashboards for Melbourne businesses across warehouse-office conversions near Swan Street and creative-tech pods in the Cremorne precinct. After handoff, power up your support experience—dial 0421498927 or go to fixwebnode.com.au/contact-support.
Architecture that scales, metrics your team trusts, and clean docs so you are never locked in.
- Real-time & scheduled data pipelines
- Role-based views for ops, finance & leadership
- Melbourne-timezone aware reporting

About this service
Get a production-grade custom dashboard built for how Melbourne teams actually work—fast load times, trusted numbers, and views your staff will open every morning.
What You'll Get
- Scoped KPI map - We lock the 8–15 metrics that move your business before a single chart is drawn, so leadership and floor staff share one source of truth.
- Production dashboard UI - Responsive layouts with filters, drill-downs, date ranges, and export—built for daily ops, not a one-off demo.
- Data layer & APIs - Aggregations, caching, and secure endpoints so widgets stay snappy under peak concurrent use.
- Role-based access - Separate views for owners, managers, and frontline staff with audit-friendly permissions.
- Handoff pack - Environment setup notes, schema map, and runbook so your team (or mine on support) can maintain it without guesswork.
- Performance baseline - Load targets and query budgets documented so the board does not crawl when traffic spikes.
Serving Richmond & surrounds
This page exists for operators in Melbourne digital-creative precinct—not a generic national template. I work with teams in converted warehouses and street-level offices along Swan Street and Church Street, plus agency and SaaS pods clustered around Cremorne’s tech strip, where dashboards must survive messy multi-source data and tight weekly reporting cycles. Demand regularly jumps through Spring Racing Carnival and Melbourne Cup week when hospitality, retail, and events businesses need live covers, bookings, and stock visibility. Nearby South Yarra and Collingwood teams are covered for workshops or on-site discovery.
- Hospitality and venue groups near Swan Street needing live covers, labour, and POS roll-ups before race-week peaks
- Product and marketing squads in the Cremorne tech pocket stitching product analytics, ads, and CRM into one leadership board
- On-site discovery available across Richmond and Cremorne; remote build preferred after kickoff, with Melbourne business-hours standups (AEDT/AEST)
My Process
- Step 1: Discovery & metric lock - Stakeholder map, data-source inventory, and a written KPI contract so we never rebuild charts because goals were fuzzy.
- Step 2: Architecture & prototype - Schema sketch, aggregation plan, wireframe of primary views, and a clickable prototype for sign-off before heavy build.
- Step 3: Build, integrate & harden - Pipelines, API layer, UI, auth, caching, and edge-case handling (nulls, late events, timezone boundaries).
- Step 4: Launch & handoff - Staging QA with your sample week of data, production deploy, training call, and support path documented.
Expert Insights: What Most People Get Wrong
Based on 10+ years of shipping analytics products and internal ops boards, here are the critical mistakes I see clients make—and how I fix them:
- Widget-level queries with no aggregation budget - Teams wire each chart straight to raw tables. Under concurrent use the board dies. I put a thin aggregation layer (materialised views or scheduled rollups) behind every widget and set a hard query-time budget (e.g. p95 under 400ms). Example: a Richmond venue group pulling every POS line on page load during Cup week will choke; pre-bucketed hourly covers + labour cost tables stay instant.
- Client-only timezone maths on Melbourne data - Storing UTC then shifting only in the browser breaks daylight-saving boundaries (AEDT/AEST) and double-counts the spring-forward hour. I normalise event time at ingest, store business_date in Australia/Melbourne, and expose both UTC and local fields so week-over-week race-carnival comparisons stay honest.
- Ignoring the slow-query path until launch day - Fancy filters that look fine on 2 weeks of demo data explode at 18 months. I force an EXPLAIN on every filter combination in staging, add composite indexes matching real filter order (tenant_id, business_date, channel), and cap unbounded date ranges with smart defaults.
- No progressive loading or stale-while-revalidate - Empty spinners for 8 seconds train staff to open Excel instead. I ship skeleton states, cache last-good payload, and background-refresh so the board feels live even when a source lags—critical when ops managers on Church Street check phones between services.
When you hire me, you get all this expertise applied directly to YOUR project—saving you time, money, and headaches.
Why Choose This Service
You get a developer who treats dashboards as products—not slide decks—with local context for how Richmond and Cremorne teams report, staff, and spike through Melbourne’s event calendar. Clean code, measurable performance, and a real support path after go-live.
- ✓ Architecture-first builds that survive growth and multi-source mess
- ✓ Melbourne business-hours collaboration and on-site options in Richmond & Cremorne
- ✓ Post-launch support via 0421498927 or fixwebnode.com.au/contact-support
Tools & Technologies
React or Next.js dashboard UIs; Node.js / Python (FastAPI) API layers; PostgreSQL with materialised views and carefully ordered indexes; Redis for cache and rate limits; dbt or SQL rollup jobs for scheduled aggregates; Charting via Recharts, ECharts, or Chart.js; auth with JWT/session + RBAC; Dockerised deploys; GitHub Actions CI; optional Metabase/Looker Studio hybrid when stakeholders need self-serve beside a custom ops board. Debugging with EXPLAIN ANALYZE, OpenTelemetry traces, and structured request logs.
Perfect For
Owners, ops leads, and product managers in Richmond, Cremorne, and nearby South Yarra who have outgrown spreadsheets or a brittle off-the-shelf board. Ideal if you run multi-location hospitality, retail, logistics, clinics, or a growing SaaS/agency team and need one trusted screen before leadership standups and peak event weeks.
Choose a package
Single-view custom dashboard with up to 6 KPIs from one primary data source.
Multi-view ops dashboard with API/data layer, RBAC, and two integrated sources.
Enterprise-ready dashboard suite with pipelines, performance budget, on-site discovery option, and extended support path.
FAQ
Both. Discovery workshops can be on-site across Richmond and the Cremorne tech strip (and nearby South Yarra) when whiteboarding data flows helps. Build, integration, and most QA are remote with Melbourne business-hours standups. Final training can be on-site or video—your call.
Common stacks include PostgreSQL/MySQL, REST and GraphQL APIs, Google Sheets for transitional metrics, Stripe, Shopify/POS exports, CRM CSVs, and warehouse tables. If a source is messy, we define a clean staging layer first so the UI never depends on brittle raw fields.
Events are normalised at ingest. I store UTC plus a business_date derived in Australia/Melbourne so AEDT/AEST transitions do not double-count or drop an hour. All period comparisons (day/week/month) use the business calendar your ops team already runs on.
You receive a runbook and clear ownership boundaries. For ongoing help, power up your support experience—dial 0421498927 or go to fixwebnode.com.au/contact-support. Premium packages include a hypercare window; other packages can add retainers as needed.