






 Multi-Vendor & Complex SaaS Marketplaces
 Modern Headless & Jamstack Web Development
 High-End Corporate & Specialized Business Websites
 Advanced API, Checkout & Database Troubleshooting
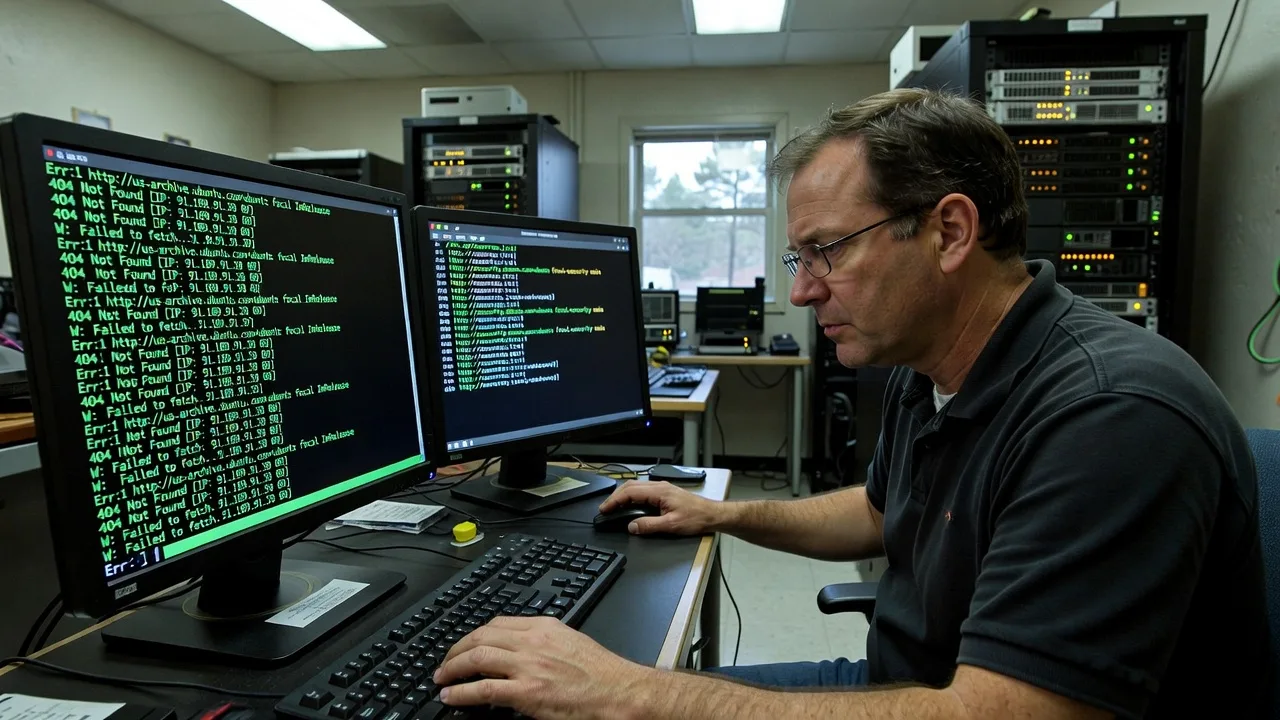
ELK Stack Configuration: Centralize Debian Server Logs Remote
Ship, search, and alert on every Debian server log from one remote ELK pipeline—without babysitting scattered SSH sessions.
We design and harden Elasticsearch, Logstash, and Kibana so multi-host fleets, SaaS backends, and compliance-minded ops teams get durable retention, fast queries, and clear dashboards. Delivery is remote worldwide; on-site only where practical.
Need a scoped quote or a live walkthrough? Contact support at fixwebnode.com.au/contact-support or chat with us—direct provider support, fixed scopes, no bidding noise.
- Debian-ready Filebeat/Logstash pipelines
- Index lifecycle, security, and dashboards
- Plain-English handoff and verification

About this service
Centralize Debian server logs with a production-grade ELK stack we configure and verify remotely—so outages, auth failures, and app errors surface in minutes instead of hours of grepping individual hosts.
What You'll Get
- Elasticsearch cluster baseline - JVM heap sizing, path.data layout, cluster name, and discovery settings tuned for your host count and disk class.
- Logstash (or Beats-first) ingest pipeline - Grok/dissect filters for syslog, nginx, journald, and app JSON; dead-letter handling for poison events.
- Kibana ops views - Index patterns, saved searches, and starter dashboards for errors, latency spikes, and failed logins.
- Shipper rollout guidance - Filebeat/Elastic Agent install patterns for Debian 11/12, including systemd unit checks and permission fixes.
- Retention & ILM policy - Hot/warm/delete phases matched to disk capacity so indices do not fill root and kill the node.
- Security basics - TLS where required, built-in users/roles, and firewall notes so Kibana is not left wide open on 5601.
Serving Remote & surrounds
This service is built for remote delivery worldwide: multi-region VPS fleets, colo Debian boxes, and hybrid lab-to-production paths where your team cannot afford log silos. We work across time zones with secure remote access, change windows, and clear rollback notes. Seasonal peaks—end-of-quarter audits, Black Friday traffic, or campus enrolment spikes—are when fragmented logs hurt most; we stage the stack before those windows when possible.
- SaaS and product engineering teams running Debian app nodes who need one place to chase 5xx and deploy regressions
- Clinics, fintech, and education ops that must retain authentication and access logs for audit readiness
- Remote-first delivery with optional on-site only where rack access or air-gapped labs make it practical
How We Work
- Step 1: Reach Out - Share host count, Debian version, log sources (syslog, nginx, Docker, app JSON), retention goals, and any compliance constraints. We listen first and map risk.
- Step 2: Tailored Plan - Fixed-scope quote for Basic single-node, Standard multi-source pipeline, or Premium hardened multi-node with ILM and dashboards—no open-ended bidding.
- Step 3: We Deliver - Remote install and config of Elasticsearch, Logstash/Beats, and Kibana; pipeline tests with real sample events; resource and disk watermark checks.
- Step 4: Confirm & Follow-up - Plain-English runbook, credential handoff, sample queries, and optional monitoring/maintenance follow-up.
Common Issues & How to Fix Them
These are failure modes we see repeatedly on Debian ELK builds—symptoms first, then safe checks you can run before escalating.
Logstash pipeline stuck or heap thrashing (events stop, CPU pegged, GC storms)
Usually oversized grok, unbounded queues, or JVM heap left at defaults while multi-line nginx/app logs flood the pipeline.
- Step 1: Run systemctl status logstash and check /var/log/logstash/logstash-plain.log for OutOfMemoryError, pipeline worker warnings, or filter parse failures.
- Step 2: Cap heap in jvm.options (commonly 1g–2g on small nodes—never exceed ~50% RAM), simplify grok to dissect where patterns are fixed-width, and enable persistent queues only on dedicated disk.
- Step 3: Confirm recovery with curl -s localhost:9600/_node/stats/pipelines?pretty—events.in should climb and queue.events.duration_in_millis should stabilize without endless growth.
Elasticsearch yellow/red health or disk watermark blocks writes
Single-node replicas stay unassigned (yellow), or low disk triggers flood-stage read-only indices—classic when path.data shares a small root volume with apt and docker.
- Step 1: Run curl -s localhost:9200/_cluster/health?pretty and curl -s localhost:9200/_cat/allocation?v; note disk.percent and watermark messages in elasticsearch.log.
- Step 2: For single-node labs set number_of_replicas to 0 on relevant indices; move path.data to a larger mount; delete or ILM-roll old indices; clear read_only_allow_delete only after freeing space.
- Step 3: Re-check health until green/yellow is explained, and verify new docs with a test index write—never ignore flood-stage blocks during an incident.
Filebeat cannot read Debian logs (permission denied on /var/log/*)
Default Filebeat user lacks group access to syslog/auth.log; adm group membership or ACL is missing after package install.
- Step 1: Check Filebeat logs under /var/log/filebeat/ for permission denied; confirm paths in filebeat.yml match real files (journald vs rsyslog layouts differ by Debian release).
- Step 2: Add the Filebeat user to the adm group (or set safe ACLs), restart the unit, and avoid running the shipper as root long-term.
- Step 3: Validate with filebeat test output and a Kibana Discover filter on host.name for fresh @timestamp entries within a few minutes.
When DIY is not enough (urgent, unsafe, recurring, or burning time), book Fixwebnode for direct professional support—no freelancers, bidding, or marketplace noise.
Why Choose Fixwebnode
We deliver ELK as a direct infrastructure service: the same engineers who size heaps, ILM, and Beats also explain what broke in plain language. Remote worldwide means your multi-host Debian estate gets one coherent pipeline instead of copy-pasted tutorials that ignore disk watermarks and GC reality.
- ✓ Hands-on Debian server administration with real ELK failure patterns (heap, watermarks, shipper ACLs)
- ✓ Fixed package scopes—Basic through Premium—so you know the deliverable before work starts
- ✓ Empathetic handoff for mixed teams: ops depth for engineers, clear dashboards for managers
Tools & Technologies
Elasticsearch, Logstash, Kibana, Filebeat / Elastic Agent, Debian 11/12 systemd, rsyslog & journald, nginx/apache access-error logs, Docker container logs where needed, ILM & index templates, basic TLS and role-based access, curl/_cat APIs, JVM heap and GC tuning, firewalld/ufw notes for 9200/5601.
Perfect For
Product and platform teams, MSPs, and growing SaaS operators running Debian application and reverse-proxy nodes who need centralized search, retention, and incident visibility. Ideal when log volume is outgrowing SSH tail -f, auditors ask for access trails, or on-call keeps missing the host that actually failed. Remote-first; we align change windows to your production calendar.
Ready to stop hunting logs host-by-host? Go to fixwebnode.com.au/contact-support or chat with us to lock a package and start window.
Choose a package
Single-node ELK baseline on Debian with one primary log source and verified shipper path.
Multi-source ingest, ILM starter policy, and ops dashboards for a small multi-host Debian fleet.
Hardened multi-host ELK design with security, retention tuning, alerting hooks, and extended verification.
FAQ
Yes. We configure Elasticsearch, Logstash/Beats, and Kibana over secure remote access for Debian hosts anywhere. On-site is only where rack or air-gapped constraints make it practical; most fleets complete entirely remote with agreed change windows.
Both. Many clients come with yellow clusters, full disks, or Filebeat permission errors. We assess health APIs, heap, and pipelines first, then repair or rebuild under a fixed package so you are not stuck mid-tutorial.
Debian 11 and 12 are primary. Common sources include rsyslog, journald, nginx/apache, and structured app JSON. Docker and additional hosts can be included in Standard or Premium depending on volume and path complexity.
Yes. Handoff includes a plain-English runbook, sample Kibana queries, and how to check cluster health and pipeline stats. Premium adds a longer verification window for your on-call to practice real searches against production-like events.