



 Multi-Vendor & Complex SaaS Marketplaces
 Modern Headless & Jamstack Web Development
 High-End Corporate & Specialized Business Websites
 Advanced API, Checkout & Database Troubleshooting
One Line of Code Burned $2,000/Hour on a GPU Rig
A single bad line kept a client’s GPU cluster at full burn until the bill hit five figures. This guide covers the diagnosis, the fix, and practical checks Australian teams can run on local AI hardware before booking on-site help.
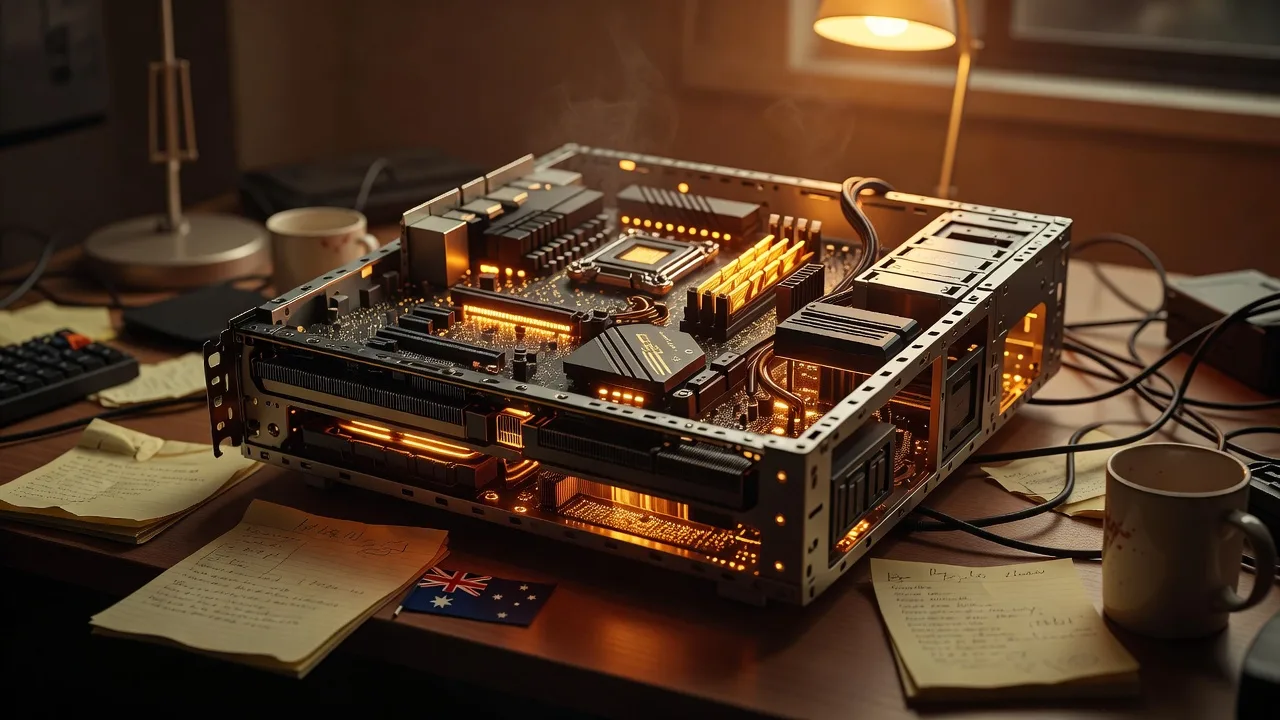
If you run local AI workstations or a small GPU cluster in Australia, a quiet coding mistake can waste serious money while the hardware looks “busy and healthy.”
We were called after a client’s training rig sat near peak draw for days. Their developers saw high utilisation and assumed the model was learning. It was not. One line of code was spinning the GPUs without useful progress, at roughly $2,000 per hour in combined power, cloud-adjacent burst capacity, and stalled project time. By the time the pattern was obvious, the damage was about $47,000. This post walks through that diagnosis, the fix, and the checks you can do on-site so the same failure does not empty your budget. For individuals, sole traders, and local operators who need hands-on help, Fixwebnode works directly on this class of AI infrastructure problem across Australia—not as a freelance marketplace, but as a specialist you book for inspection and repair.
Why a “busy” GPU can still be burning money
High fan noise and 99% utilisation feel productive. On local hardware they often mean a stuck data loader, a device index pointing at the wrong card, or a training step that never advances. Power meters climb, jobs never finish, and overnight runs become multi-day burns. Teams in Australia feel this harder when power tariffs, heat, and limited spare GPUs leave no slack. The lesson from the $47,000 case is simple: treat unexplained full-load GPU behaviour as a fault until you prove otherwise.
How do I know if one bad line is wasting money on my GPU workstation in Australia?
Watch for cards at full power with no falling loss curve, no checkpoint growth, and no dataset progress after a full epoch window. If the chassis is hot, the power strip is heavy, and the job log is silent or repeating the same step, stop the run and inspect before another billable hour stacks up. Local checks beat guessing from a dashboard alone.
| Symptom | Quick check | When to call Fixwebnode |
|---|---|---|
| GPUs pegged, no model progress | Confirm loss/checkpoints actually change | Logs look fine but hardware stays maxed |
| Only some cards hot | Verify which physical GPU the app selected | Multi-GPU cabling or device map unclear |
| Jobs crawl, fans scream | Dust, airflow, and thermal contact | Throttling continues after a clean-out |
Common issues that mirror the $2,000/hour failure
These problems are distinct. Each can look like “the cluster is working hard” while money drains.
1. Zombie training loop — full load, zero learning
Symptoms: Utilisation stuck near 100%, temperature high, epoch timer never advances, checkpoint folder size unchanged, loss line flat or NaN spam. This was the core of the client incident: a single iterator line never yielded new batches, so the GPUs thrashed empty work.
2. Wrong GPU selected on a multi-card rig
Symptoms: One card scorching while others idle warm; the app “sees” CUDA but trains on a display GPU or a secondary card left powered for PCIe noise; wall power high because idle cards never fully sleep.
3. Thermal and airflow failure that multiplies job time
Symptoms: Loud fans, thermal throttle, same job taking 3–5× longer than last month, hot exhaust, dust caked on shrouds. Cost explodes because every epoch burns more wall-clock energy even when the code is correct.
4. Driver or firmware wake that never lets the discrete GPU sleep
Symptoms: Workstation idle at the desktop yet the discrete GPU stays in a high power state; external monitor path or a hung compute context keeps the card awake overnight.
How to fix each issue on local hardware
Work on the machine in front of you. Power down safely before opening a chassis. Back up project folders and model weights before you change drivers or reseat cards. These steps are written for on-site AI workstations and small rack or desk clusters—not remote shell playbooks.
Fix 1 — Stop the zombie loop and prove the job is moving
- Halt the run cleanly from the training UI or process manager so the GPUs drop load. Note the exact start time and power reading if you have a metered PDU or smart plug.
- Inspect outputs, not vibes. Open the run directory. Confirm new checkpoint files appear with fresh timestamps and growing size. Open the latest log and verify step index, samples seen, and loss values change across a few minutes of a short test run.
- Run a tiny known-good job (small model, few steps, fixed seed) on the same machine. If this completes and writes artefacts while the production script does not, the hardware is fine and the script path is guilty—the same pattern as the single-line failure.
- Diff the data pipeline. Check shuffle flags, infinite generators, empty cache folders, and paths that point at a missing mount. A loader that never ends or never yields keeps kernels scheduled with nothing useful to compute.
- Only resume full-scale training after a short run shows decreasing loss and new checkpoints. That single discipline would have prevented most of the $47,000 burn.
When to call a pro / Fixwebnode: If short test jobs also hang at full GPU power with no artefacts, the fault may be driver, card, or board-level—not just Python. Book an on-site inspection rather than burning another night.
Fix 2 — Confirm the physical GPU the software actually uses
- Label the cards in the chassis (slot order, serial stickers). Photograph the PCIe layout before you move anything.
- In the training app or framework UI, list visible devices and note which index is selected. Compare that to which card’s fans ramp when you start a 60-second test.
- Feel and observe: the active card’s exhaust should respond within seconds. If a different card heats up, your device map is wrong even if the UI says “GPU 0.”
- Reseat power connectors (12VHPWR / 8-pin) only after full shutdown and PSU drain. Loose sense pins can leave a card half-alive and drawing waste current.
- Disable unused cards in the OS device panel for a controlled test, or physically remove a spare card if the chassis design allows, so you prove single-card behaviour.
When to call Fixwebnode: Mixed vendor cards, bifurcation surprises, or riser cables that drop a device under load need hands-on hardware sorting. Bring notes on which slot maps to which index.
Fix 3 — Clear thermal bottlenecks that stretch every epoch
- Power off, unplug, and open the case in a static-safe workspace. Photograph cable routing.
- Clean intake filters, GPU shrouds, and radiator fins with appropriate anti-static brush and controlled air. Do not spin fans with unregulated pressure.
- Check that GPU support brackets are not sagging the card into the next slot’s airflow path.
- Verify case intake/exhaust direction and that nothing blocks rear exhaust—common on cramped office desks in warm Australian summers.
- After reassembly, run the known-good short job and watch whether clocks hold or drop. If clocks collapse within minutes despite a clean path, paste or pad replacement and deeper inspection are next.
When to call Fixwebnode: Repeated thermal throttle after cleaning, uneven hotspot on one memory bank, or liquid-loop maintenance is specialist work. On-site service across the Australia service area is the safer path than forcing another overnight run.
Fix 4 — Force a true idle and clear stuck compute contexts
- Close every training UI, notebook kernel, and browser tab attached to local UIs that might hold a CUDA context.
- Use the OS graphics panel to confirm the discrete GPU returns to an idle or low-power state after five quiet minutes. If it stays elevated with nothing scheduled, note whether an external display is routed through that GPU.
- Reboot once after a full shutdown (not only a warm restart) so firmware and driver power states reset.
- Reconnect monitors to the port you intend (iGPU vs dGPU) and retest idle draw on your meter.
- If idle power remains high, stop experimenting with random driver downloads. Capture the GPU model, driver branch currently installed, and a photo of Device Manager / system info for whoever services the box.
When to call Fixwebnode: Persistent high idle draw, black screens on boot after driver changes, or multi-monitor instability after compute jobs points to on-site driver and hardware triage.
When DIY is enough vs when to book Fixwebnode
DIY is enough when a short known-good job completes, checkpoints appear, the correct physical card heats under load, and idle power drops after you stop the process. Document what you changed so the next run has a baseline.
Book Fixwebnode when full-load behaviour continues with no artefacts, when multi-GPU mapping disagrees with the chassis, when thermal faults return after cleaning, or when you cannot risk another multi-thousand-dollar overnight surprise. Bring or have ready: the workstation or nodes in question, a brief timeline of the failed runs, which frameworks you use, and a backup of weights and configs. Expect a practical inspection of power, thermals, device visibility, and the failure pattern—not a marketplace bidding thread. Coverage details live on the all service areas hub if you are confirming geography only.
The $47,000 lesson, in plain terms
Utilisation is not progress. A single bad line—or a wrong device index, or a choked heatsink—can hold GPUs at peak burn while learning never happens. The client’s team was not careless; they trusted the wrong signal. The fix was boring and local: stop the run, prove artefacts move, align software device IDs with physical cards, restore cooling headroom, and only then scale back up. Save that sequence if you operate AI infrastructure on-site.
Talk to Fixwebnode about your GPU rig
If your local AI hardware in Australia is loud, hot, and expensive without finishing jobs, start a direct conversation before the next long run. Book a specialist review with Fixwebnode for on-site or drop-off diagnosis aimed at stopping wasteful GPU burn, clarifying device mapping, and stabilising the machine you already own. Bring backups, model notes, and a clear description of the symptoms—we will take it from the hardware up.